
Patient-level learning: when one example is many cells#

The previous tutorial treated one cell as one training example. Some questions are not about a single cell but about the whole sample it came from. Does this heart show an infarction? There the training example is a patient, represented by all of their cells, and the label belongs to the group.
A per-cell loader like AnnLoader cannot express that, because it batches individual rows. The fix is the same Dataset interface as before: we write one whose __getitem__ returns a group of cells. We first build a minimal version by hand to see the idea, then use the ready-made, distribution-based version from the ggml-ot package.
The focus here is the PyTorch side, how you represent a group-level example. For the optimal-transport method itself, its evaluation, tuning, and biology, see the ggml-ot tutorials.
Setup#
On Google Colab, run the install cell once. It uses the same ~1.9 GB dataset cached under ../data/ as the other notebooks.
import IPython

# Setup environment: run this cell once.
try:
    import numpy as np
    import torch
    import scanpy as sc
    import ggml_ot
    import matplotlib.pyplot as plt
    print("All dependencies are installed and loaded successfully!")
except ImportError:
    print("Required packages not found. Installing now...")
    ipy_v = IPython.__version__
    print(f"Protecting the current IPython version (v{ipy_v})...")
    %pip install -q "scanpy" "ggml-ot==0.9.93" "ipython=={ipy_v}"
    print("Installation complete! Restart the kernel to load new packages.")
All dependencies are installed and loaded successfully!
import numpy as np
import torch
from torch.utils.data import Dataset
import scanpy as sc
import ggml_ot
import matplotlib.pyplot as plt
%matplotlib inline

sc.settings.verbosity = 0
ggml_ot.settings.random_seed = 0   # reproducible cell sampling and metric training
torch.manual_seed(0)
<torch._C.Generator at 0x7f0540333f10>
The dataset#
We reuse the human heart atlas: cells from 20 donors, some with a myocardial infarction and some healthy. We subsample and keep 2000 variable genes as before. Here the label of interest is the whole-patient disease status, and donor_id tells us which cells belong to which patient.
dataset_id = "c1f6034b-7973-45e1-85e7-16933d0550bc.h5ad"
adata = ggml_ot.data.load_cellxgene(dataset_id, path="../data/")

sc.pp.subsample(adata, n_obs=15000, random_state=0)
adata.var_names = adata.var["feature_name"].astype(str)
adata.var_names_make_unique()
sc.pp.highly_variable_genes(adata, n_top_genes=2000)
adata = adata[:, adata.var.highly_variable].copy()

print("cells:", adata.n_obs, " donors:", adata.obs["donor_id"].nunique())
adata.obs.groupby("donor_id")["disease"].first().value_counts()
cells: 15000 donors: 20
disease
myocardial infarction    16
normal                    4
Name: count, dtype: int64
One example is a whole patient#
The disease label is a property of the donor, not the cell. Every cell from an infarcted heart shares it. To predict it, the natural training example is a patient: all of that donor’s cells, with a single label. AnnLoader batches individual cells, so it cannot hand the loop a whole patient at once.
A Dataset has no such limit. Its __getitem__ can return anything, including a group of cells. Here is a minimal version that returns one patient’s expression matrix and label.
class PatientDataset(Dataset):
    """One datapoint is all cells of one patient, with the patient's label."""

    def __init__(self, adata, patient_col, label_col):
        self.adata = adata
        self.patient_col = patient_col
        self.label_col = label_col
        self.patients = list(adata.obs[patient_col].unique())

    def __len__(self):
        return len(self.patients)

    def __getitem__(self, i):
        cells = self.adata[self.adata.obs[self.patient_col] == self.patients[i]]
        X = torch.tensor(cells.X.toarray(), dtype=torch.float32)
        return X, cells.obs[self.label_col].iloc[0]


patients = PatientDataset(adata, patient_col="donor_id", label_col="disease")
X0, label0 = patients[0]
print("patients:", len(patients))
print("patient 0 cells:", tuple(X0.shape), "| label:", label0)

sizes = adata.obs["donor_id"].value_counts()
print("cells per patient: min", int(sizes.min()), "max", int(sizes.max()))
patients: 20
patient 0 cells: (1916, 2000) | label: myocardial infarction
cells per patient: min 218 max 1916
Examples of different sizes#
Each patient has a different number of cells. A standard DataLoader stacks examples into one rectangular tensor, which fails when they are different sizes. The usual options are: use batch_size=1, write a custom collate_fn that keeps the groups as a list, or sample a fixed number of cells per patient so they stack. That last option also treats each patient as a fixed-size sample from an underlying distribution of cells, which is the view the method below builds on.
A ready-made version: ggml-ot#
The ggml-ot package provides this Dataset, built for comparing patient groups. ggml_ot.from_anndata samples a fixed number of cells per patient (so they stack) and represents each patient as an empirical distribution over gene space, adding the triplets used to learn a metric that pulls same-group patients together and pushes different groups apart. We reduce each distribution to the precomputed PCA coordinates with use_rep="X_pca" to keep it fast.
triplets = ggml_ot.from_anndata(
    adata, patient_col="donor_id", label_col="disease",
    n_cells=200, use_rep="X_pca",
)

support, _, _, label = triplets[0]
print("patients:", len(triplets))
print("one patient distribution:", tuple(support.shape), "| label:", int(label))
patients: 20
one patient distribution: (200, 30) | label: 1
Training the metric#
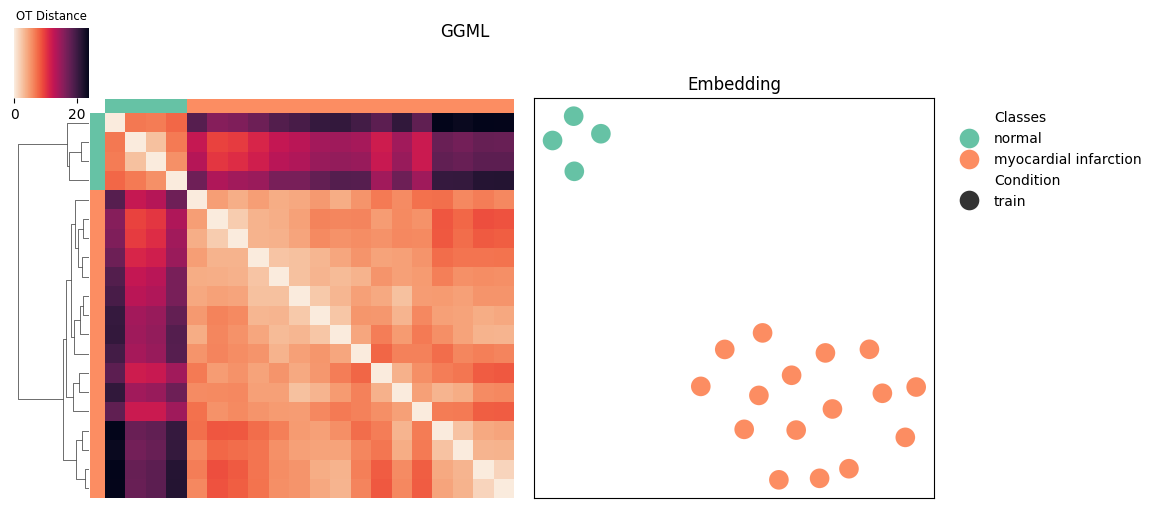
train learns a linear ground metric so that patients in the same disease state sit closer than patients in different states. This is the slowest cell in the notebook. entropic_reg=0.5 switches the optimal-transport step to the Sinkhorn solver, which is faster, especially on a GPU. We use n_comps=2 so the learned space is easy to plot.
triplets.train(n_comps=2, entropic_reg=0.5, max_iter=30)
Compute all OT distances after 21 iterations
/opt/hostedtoolcache/Python/3.10.20/x64/lib/python3.10/site-packages/ggml_ot/data/anndata.py:196: UserWarning: Cannot project W_ggml back to gene space, since use_rep X_pca has no inverse transform (no .varm[X_pca]). GGML components only stored in .uns, and not in .varm
  warnings.warn(
<ggml_ot.data.anndata.AnnData_TripletDataset at 0x7f04400d5e70>
The learned space#
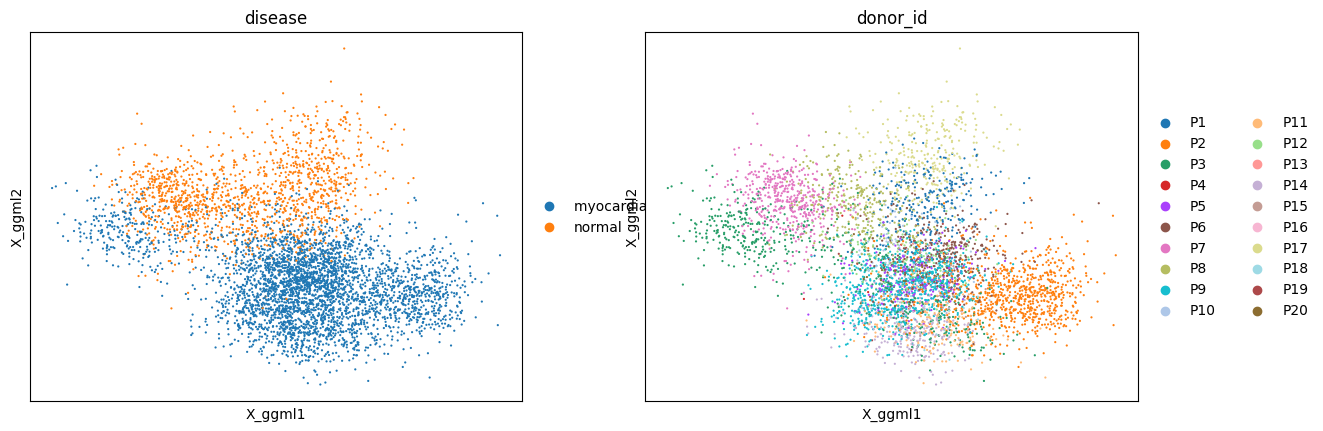
train writes a per-cell embedding in the learned space to adata.obsm["X_ggml"]. Plotting it for one cell type shows the disease states separating, and colouring the same points by donor shows the split holds across patients rather than reflecting a single batch. Evaluating the metric against baselines, tuning it, and interpreting what it captures are covered in the ggml-ot tutorials.
adata = triplets.adata
cardiomyocytes = adata[adata.obs["cell_type"] == "cardiac muscle myoblast"]
sc.pl.embedding(cardiomyocytes, basis="X_ggml", color=["disease", "donor_id"], s=10)
/opt/hostedtoolcache/Python/3.10.20/x64/lib/python3.10/site-packages/scanpy/plotting/_utils.py:465: ImplicitModificationWarning: Trying to modify attribute `._uns` of view, initializing view as actual.
  adata.uns[f"{value_to_plot}_colors"] = colors_list
Recap#
The one thing that changed for a patient-level task was the Dataset: its __getitem__ returns a group of cells instead of a single cell. The model and the loop are ordinary PyTorch, and so is handling different-sized groups. ggml-ot packages this pattern into a full optimal-transport method, and its own tutorials cover the evaluation, tuning, and biology that go beyond the PyTorch plumbing shown here.